
Edmonton area profile
Horse Hill
Covers the developing Horse Hill area — Marquis, Quarry Ridge and rural northeast lands.
Horse Hill groups 6 Edmonton neighbourhoods — about 2,167 homes, 100% houses and 0% condos. The typical (median) house is assessed around $167,500, 64% below the citywide median. Across its established houses, the median assessed value changed -39% from 2012 to 2026. 84% of homes are owner-occupied, the average household income is about $86,134. Area figures are averages and City assessed values — directional, not sale prices ("typical" means the median; averages are noted as such).
“Horse Hill” follows the City of Edmonton's official Horse Hill planning district — one of 15 the City uses to group its 300+ neighbourhoods. Figures roll up the City's 2026 assessed values and the 2021 federal census across the area's neighbourhoods. Where a median can't be combined across neighbourhoods (income, age, shelter), the page shows the average instead — so those read higher than the medians on the neighbourhood pages and aren't directly comparable.
Neighbourhoods
6
profiled in this area
Total homes
2,167
100% houses · 0% condos
Typical house
$167,500
64% below citywide
House $/sq ft
$119
63% below citywide
Typical lot
3,993 ft²
24% below citywide
Avg. household income
$86,134
2021 · average, not median
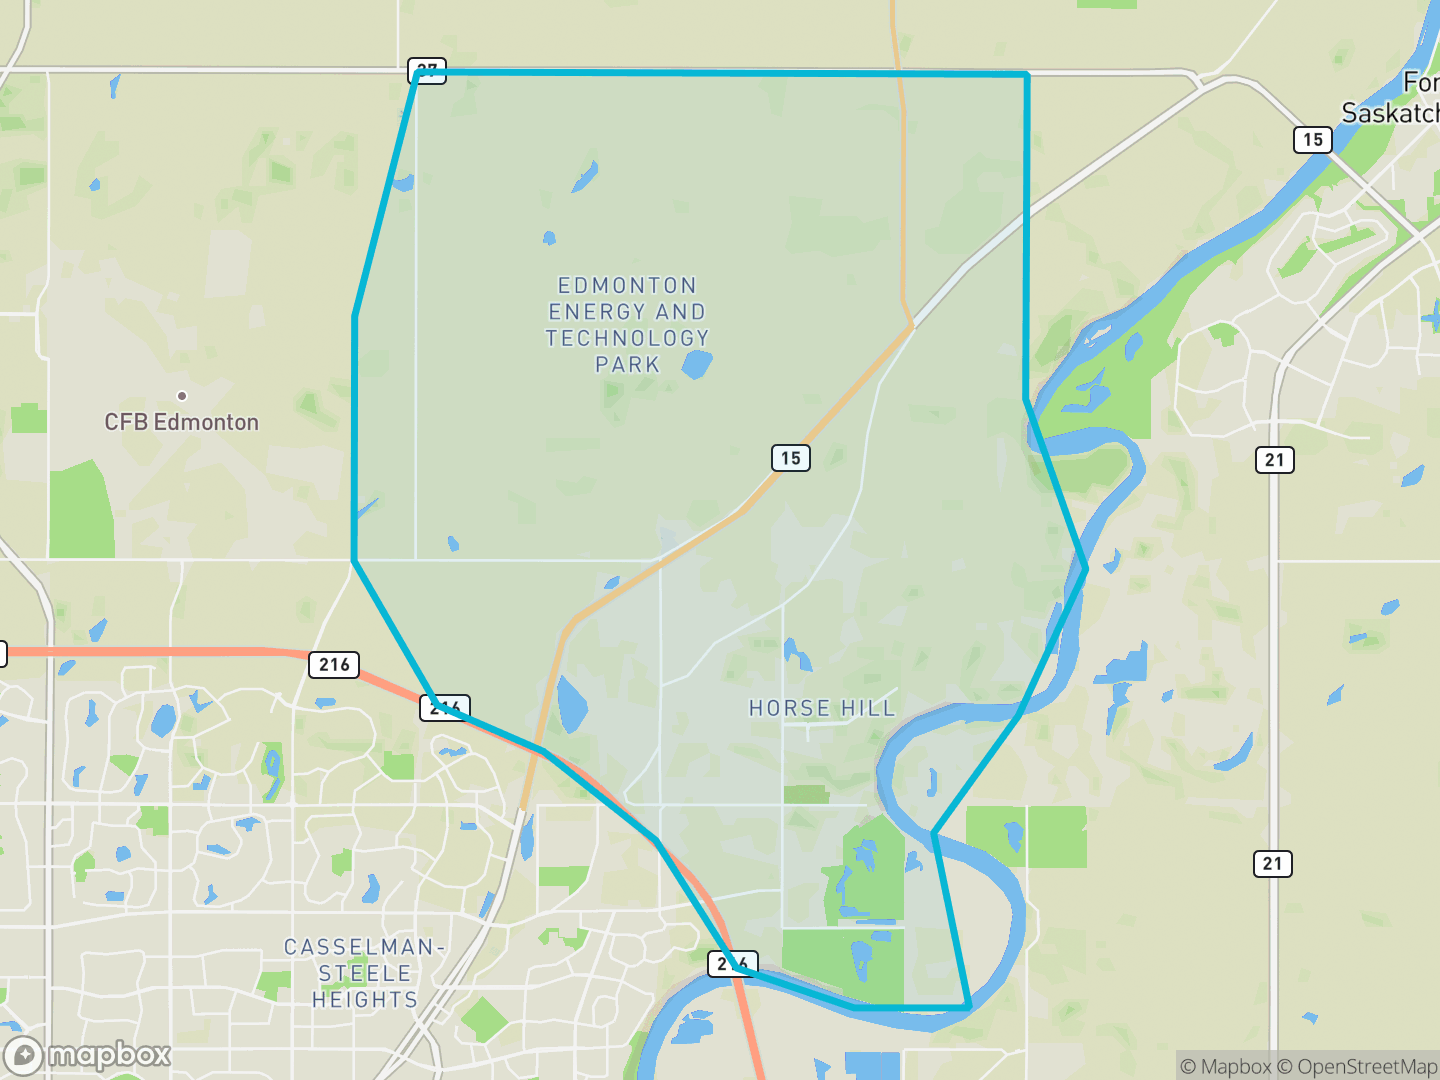
Where it is
At a glance. Horse Hill and its boundary — green areas are parks and open space.
Stay in the loop
Get the Edmonton market update
My monthly read — what's selling, where prices are headed, and what it means.
The homes
What's here, when it was built, and the condo & rental stock — rolled up across the area's neighbourhoods.
What's here
Mostly houses. 100% houses · 0% condos.
Built-form mix & bedrooms (2021 census · 39% coverage)
When it was built
Most homes here were built in the 2020s. The median build year is 2002.
Building age, by decade
Condos & multi-family
2 purpose-built rental / multi-family buildings.
How the condo & rental stock breaks down
2 rental / multi-family buildings — 2 mid ($1–10M). Purpose-built rentals (assessed as single parcels), separate from the owned homes; unit counts aren't in the open data.
Living here
Who lives in the area, what housing costs, and the schools, shopping, transit and parks across the district (census coverage 39% — read as directional).
Who lives here
Mostly homeowners. Average household income $86,134, average age 42.2.
Income, age and household size are averages (these combine exactly across neighbourhoods, where a median can't) — so they read higher than the medians shown on the neighbourhood pages. The distribution shares below are exact counts.
Income, households, ages, work & mobility
Households (average 2.3 people)
Ages (average 42.2)
Work — occupations
Work — industries
32% of residents moved here within the last 5 years (12% within the last year).
Origins, immigration & religion
91% born in Canada · 9% immigrants.
Most commonly reported origins (multiple responses allowed — shares overlap)
Population groups
9% of residents identified as a visible minority; 91% did not. Separately, 14% identify as Indigenous.
StatCan defines a "visible minority" as "persons, other than Aboriginal peoples, who are non-Caucasian in race or non-white in colour" (Employment Equity Act) — so Indigenous residents are counted separately, and the "not a visible minority" share is predominantly residents who identify as white.
Religion
Immigration, ethnocultural origin, population group and religion from the 2021 federal census, summed across the district's neighbourhoods. Neutral Statistics Canada classifications, shown identically for every area.
Housing costs
Owners pay about $1,000/month; renters about $1,650/month. Average monthly shelter cost, 2021.
Schools
1 school across Horse Hill — 1 public · 0 Catholic.
Schools by level
Counts schools located in the district (a school offering several levels is counted in each). Public = Edmonton Public, Catholic = Edmonton Catholic. Fraser Institute rankings → · private/independent schools aren't in the City's open data.
Parks & green space
14 parks covering about 155 hectares, including 10 natural areas.
The largest parks
- Rural North East South Sturgeon Park13 ha
- Quarry Ridge Park 112 ha
- Evergreen/Marquis Park 112 ha
- Rural North East South Sturgeon Park 59 ha
The market
How assessed values have moved, and how much has been built.
Assessed value over time
The median assessed house value changed -39% from 2012 to 2026.
Established houses — largely the same properties over time, so this mostly reflects real value change.
Building activity
Since 2015: 1,101 building permits and 901 net new units, plus 84 secondary suites.
Permits, units & suites year by year
Permits count every new home — including purpose-built rental and mixed-use buildings — so the yearly units can run above the owned house/condo count above. “Units” are net of demolitions, so a redeveloping year can read negative; “suites” are secondary-suite permits (basement / garden / garage suites).
The neighbourhoods
Every neighbourhood in Horse Hill, sorted by number of homes — each links to its full data-driven profile.
- Marquis 800 homes · typical house $329,000
- Evergreen 647 homes · typical house $50,500
- Quarry Ridge 497 homes · typical house $680,000
- Edmonton Energy And Technology Park 101 homes · typical house $590,000
- Rural North East Horse Hill 69 homes · typical house $665,500
- Rural North East South Sturgeon 53 homes · typical house $605,000
Source
City of Edmonton Open Data — property assessment & property information (2026 assessment roll), building permits; Statistics Canada 2021 Census of Population (City of Edmonton neighbourhood tabulation); area boundaries from City Plan Districts. Contains information licensed under the Open Government Licence – City of Edmonton. Demographics: Statistics Canada 2021 Census of Population (City of Edmonton neighbourhood tabulation). Area boundaries: City Plan Districts.
About these figures. Area figures roll up the City's 2026 assessment roll (its mass-appraisal estimate of market value as of July 1, 2025) and the 2021 federal census across this district's neighbourhoods — a directional, comparative signal, not the price a specific home would sell for. Income, age and shelter figures are averages (labelled), which read higher than medians and aren't directly comparable to the neighbourhood pages. Trevor Tardif is a licensed REALTOR® with REAL Broker AB Ltd, Edmonton, Alberta. Content on this site does not constitute financial or investment advice.
Zooming out: see the Edmonton economy — jobs, rents, vacancy and interest rates for the whole region.
Stay in the loop
Following Horse Hill? Get the bigger picture.
Horse Hill is one part of the city — but the forces that move its prices play out region-wide. That's what my market read tracks.
Weighing Horse Hill against another part of the city?
The profiles are the starting point. I'll run the comparison for your shortlist — what each area actually trades at, and which neighbourhoods fit what you're after — and walk you through it.