Edmonton area profile
North Central
Covers the 118 Avenue / Alberta Avenue corridor, Highlands and Beverly.
North Central groups 19 Edmonton neighbourhoods — about 16,599 homes, 81.8% houses and 18.2% condos. The typical (median) house is assessed around $294,500, 34% below the citywide median; condos around $122,500. Across its established houses, the median assessed value changed +19% from 2012 to 2025. 54% of homes are owner-occupied, the average household income is about $80,993. Area figures are averages and City assessed values — directional, not sale prices ("typical" means the median; averages are noted as such).
“North Central” follows the City of Edmonton's official North Central planning district — one of 15 the City uses to group its 300+ neighbourhoods. Figures roll up the City's 2025 assessed values and the 2021 federal census across the area's neighbourhoods. Where a median can't be combined across neighbourhoods (income, age, shelter), the page shows the average instead — so those read higher than the medians on the neighbourhood pages and aren't directly comparable.
Neighbourhoods
19
profiled in this area
Total homes
16,599
81.8% houses · 18.2% condos
Typical house
$294,500
34% below citywide
Typical condo
$122,500
35% below citywide
House $/sq ft
$280
8% below citywide
Condo $/sq ft
$126
34% below citywide
Typical lot
5,436 ft²
1% above citywide
Avg. household income
$80,993
2021 · average, not median
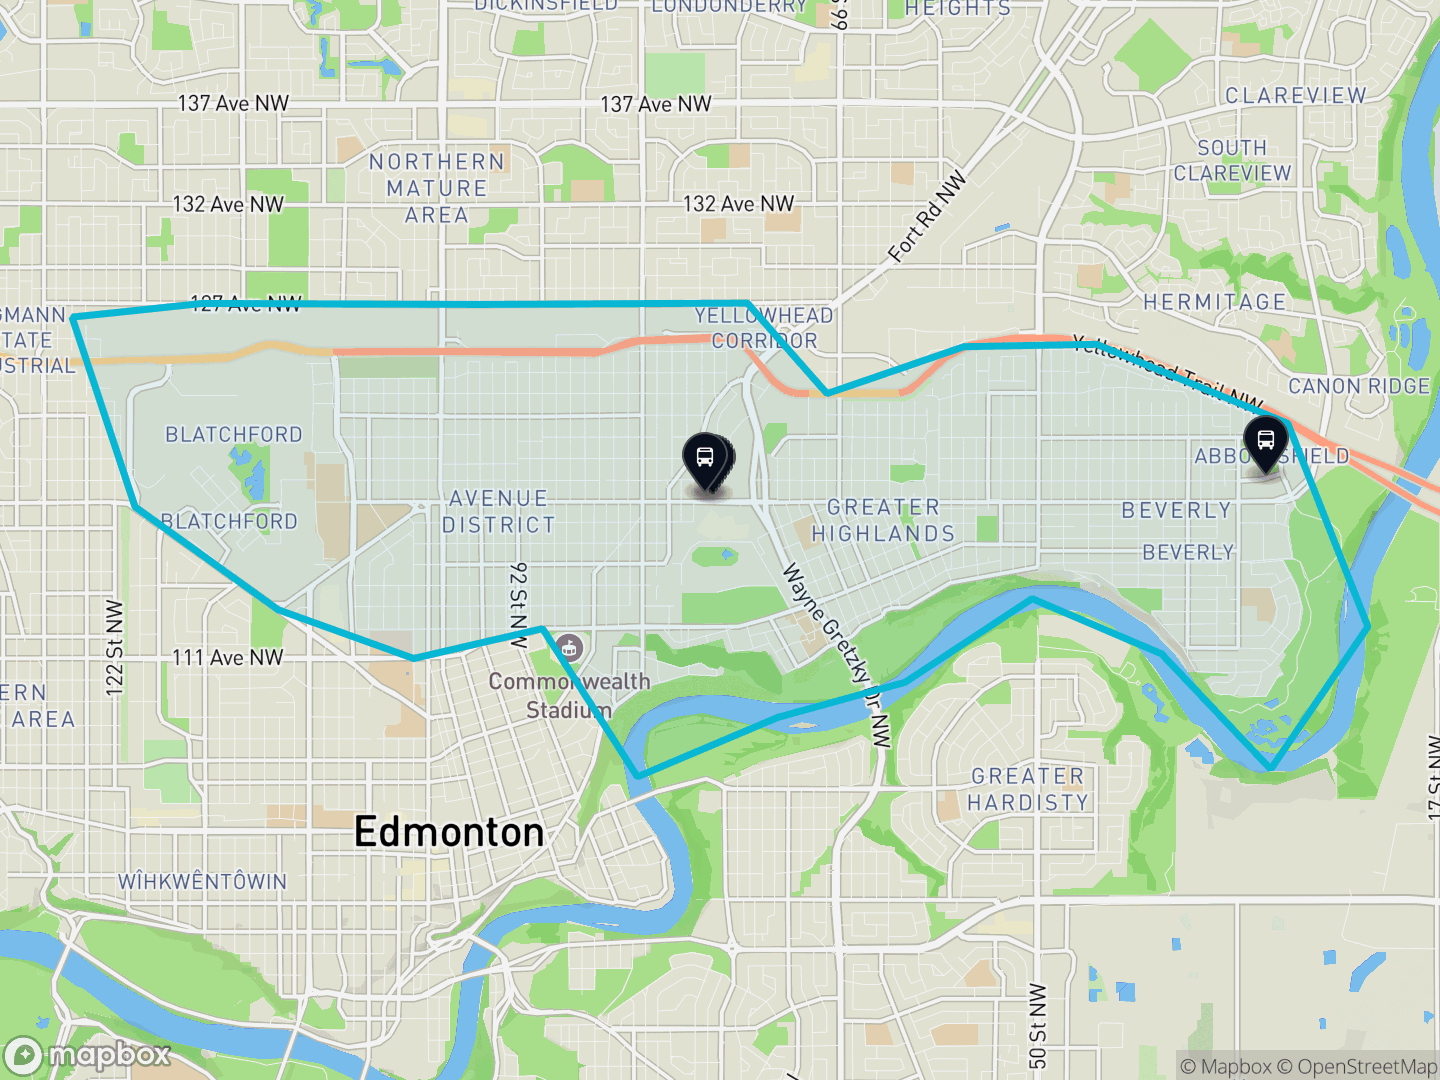
Where it is
At a glance. North Central and its boundary, with LRT and transit centres marked — green areas are parks and open space.
Stay in the loop
Get the Edmonton market update
My monthly read — what's selling, where prices are headed, and what it means.
The homes
What's here, when it was built, and the condo & rental stock — rolled up across the area's neighbourhoods.
What's here
Mostly houses. 81.8% houses · 18.2% condos.
Built-form mix & bedrooms (2021 census · 128% coverage)
When it was built
Most homes here were built before 1960. The median build year is 1955.
Building age, by decade
Condos & multi-family
Condos are 18.2% of homes — most in Cromdale, Parkdale and Rundle Heights. Plus 612 purpose-built rental buildings.
How the condo & rental stock breaks down
Across roughly 287 condo developments, the largest about 184 units. Separately-titled parking and storage aren't counted as homes.
612 rental / multi-family buildings, typically built around 1976 — 359 small (under $1M), 239 mid ($1–10M), 14 large (over $10M). Purpose-built rentals (assessed as single parcels), separate from the owned homes; unit counts aren't in the open data.
Living here
Who lives in the area, what housing costs, and the schools, shopping, transit and parks across the district.
Who lives here
An even owner / renter mix. Average household income $80,993, average age 40.4.
Income, age and household size are averages (these combine exactly across neighbourhoods, where a median can't) — so they read higher than the medians shown on the neighbourhood pages. The distribution shares below are exact counts.
Income, households, ages, work & mobility
Household income (29% earn $100k+)
Households (average 2.2 people)
Ages (average 40.4)
Work — occupations
Work — industries
45% of residents moved here within the last 5 years (16% within the last year).
Origins, immigration & religion
73% born in Canada · 25% immigrants · 1% non-permanent residents.
Most commonly reported origins (multiple responses allowed — shares overlap)
Population groups
29% of residents identified as a visible minority; 71% did not. Separately, 12% identify as Indigenous.
StatCan defines a "visible minority" as "persons, other than Aboriginal peoples, who are non-Caucasian in race or non-white in colour" (Employment Equity Act) — so Indigenous residents are counted separately, and the "not a visible minority" share is predominantly residents who identify as white.
Religion
Immigration, ethnocultural origin, population group and religion from the 2021 federal census, summed across the district's neighbourhoods. Neutral Statistics Canada classifications, shown identically for every area.
Housing costs
Owners pay about $1,352/month; renters about $1,119/month. Average monthly shelter cost, 2021.
Schools
17 schools across North Central — 11 public · 6 Catholic. Senior highs: amiskwaciy Academy, Eastglen.
Schools by level & senior highs
Counts schools located in the district (a school offering several levels is counted in each). Public = Edmonton Public, Catholic = Edmonton Catholic. Fraser Institute rankings → · private/independent schools aren't in the City's open data.
Shopping
Major shopping centres here: Kingsway Mall.
Edmonton's major malls and power centres located in this district. Everyday retail (groceries, pharmacies, services) is spread across the neighbourhoods.
Transit
Served by the Capital Line, with 1 LRT station in the area and 2 transit centres.
LRT stations & transit centres
LRT: Coliseum (Capital Line).
Transit centres: Abbottsfield Transit Centre, Coliseum Transit Centre.
Parks & green space
82 parks covering about 368 hectares, including 3 natural areas and river-valley / ravine greenway.
The largest parks
- Highlands West60 ha
- Borden Outdoor Pool20 ha
- BM16 ha
The market
How assessed values have moved, and how much has been built.
Assessed value over time
The median assessed house value changed +19% from 2012 to 2025.
Established houses — largely the same properties over time, so this mostly reflects real value change.
Building activity
Since 2015: 6,138 building permits and 2,932 net new units, plus 785 secondary suites.
Permits, units & suites year by year
Permits count every new home — including purpose-built rental and mixed-use buildings — so the yearly units can run above the owned house/condo count above. “Units” are net of demolitions, so a redeveloping year can read negative; “suites” are secondary-suite permits (basement / garden / garage suites).
The neighbourhoods
Every neighbourhood in North Central, sorted by number of homes — each links to its full data-driven profile.
- Alberta Avenue 2,298 homes · typical house $240,000
- Parkdale 1,434 homes · typical house $240,500
- Beverly Heights 1,218 homes · typical house $307,000
- Montrose 1,159 homes · typical house $252,000
- Newton 1,146 homes · typical house $302,000
- Highlands 1,142 homes · typical house $427,500
- Beacon Heights 1,132 homes · typical house $277,000
- Eastwood 1,107 homes · typical house $263,500
- Rundle Heights 974 homes · typical house $326,000
- Delton 733 homes · typical house $274,500
- Cromdale 700 homes · typical house $483,500
- Westwood 695 homes · typical house $311,000
- Bergman 636 homes · typical house $344,000
- Spruce Avenue 547 homes · typical house $307,750
- Bellevue 468 homes · typical house $336,750
- Elmwood Park 407 homes · typical house $298,500
- Abbottsfield 376 homes
- Blatchford Area 220 homes · typical house $631,250
- Virginia Park 207 homes · typical house $382,250
Source
City of Edmonton Open Data — property assessment & property information, building permits (2025); Statistics Canada 2021 Census of Population (City of Edmonton neighbourhood tabulation); area boundaries from City Plan Districts. Contains information licensed under the Open Government Licence – City of Edmonton. Demographics: Statistics Canada 2021 Census of Population (City of Edmonton neighbourhood tabulation). Area boundaries: City Plan Districts.
About these figures. Area figures roll up the City's mass-appraisal assessed values and the 2021 federal census across this district's neighbourhoods — a directional, comparative signal, not the price a specific home would sell for. Income, age and shelter figures are averages (labelled), which read higher than medians and aren't directly comparable to the neighbourhood pages. Trevor Tardif is a licensed REALTOR® with REAL Broker AB Ltd, Edmonton, Alberta. Content on this site does not constitute financial or investment advice.
Zooming out: see the Edmonton economy — jobs, rents, vacancy and interest rates for the whole region.
Stay in the loop
Following North Central? Get the bigger picture.
North Central is one part of the city — but the forces that move its prices play out region-wide. That's what my market read tracks.
Weighing North Central against another part of the city?
The profiles are the starting point. I'll run the comparison for your shortlist — what each area actually trades at, and which neighbourhoods fit what you're after — and walk you through it.