Greater Edmonton community
Morinville
Morinville is a community in the Greater Edmonton area, home to about 10,385 people (2021 census). All residential sold for a median of $438,500 in May 2026 (-0.3% year-over-year). The median household income is $108,000, and 83% of homes are owner-occupied. Market figures are from the REALTORS® Association of Edmonton; demographics from the 2021 federal census. Directional only — not the price a specific home would sell for today.
Demographics are the 2021 federal census for the Morinville census subdivision (Town of Morinville). Market figures are derived from the REALTORS® Association of Edmonton monthly municipality statistics.
Median sale price
$409,225
12-mo rolling · +1.9% YoY
Sales (year to date)
106
2026 YTD · +30.9% YoY
Median household income
$108,000
2021 census
Own their home
83%
17% rent · 2021
Population
10,385
2021 census
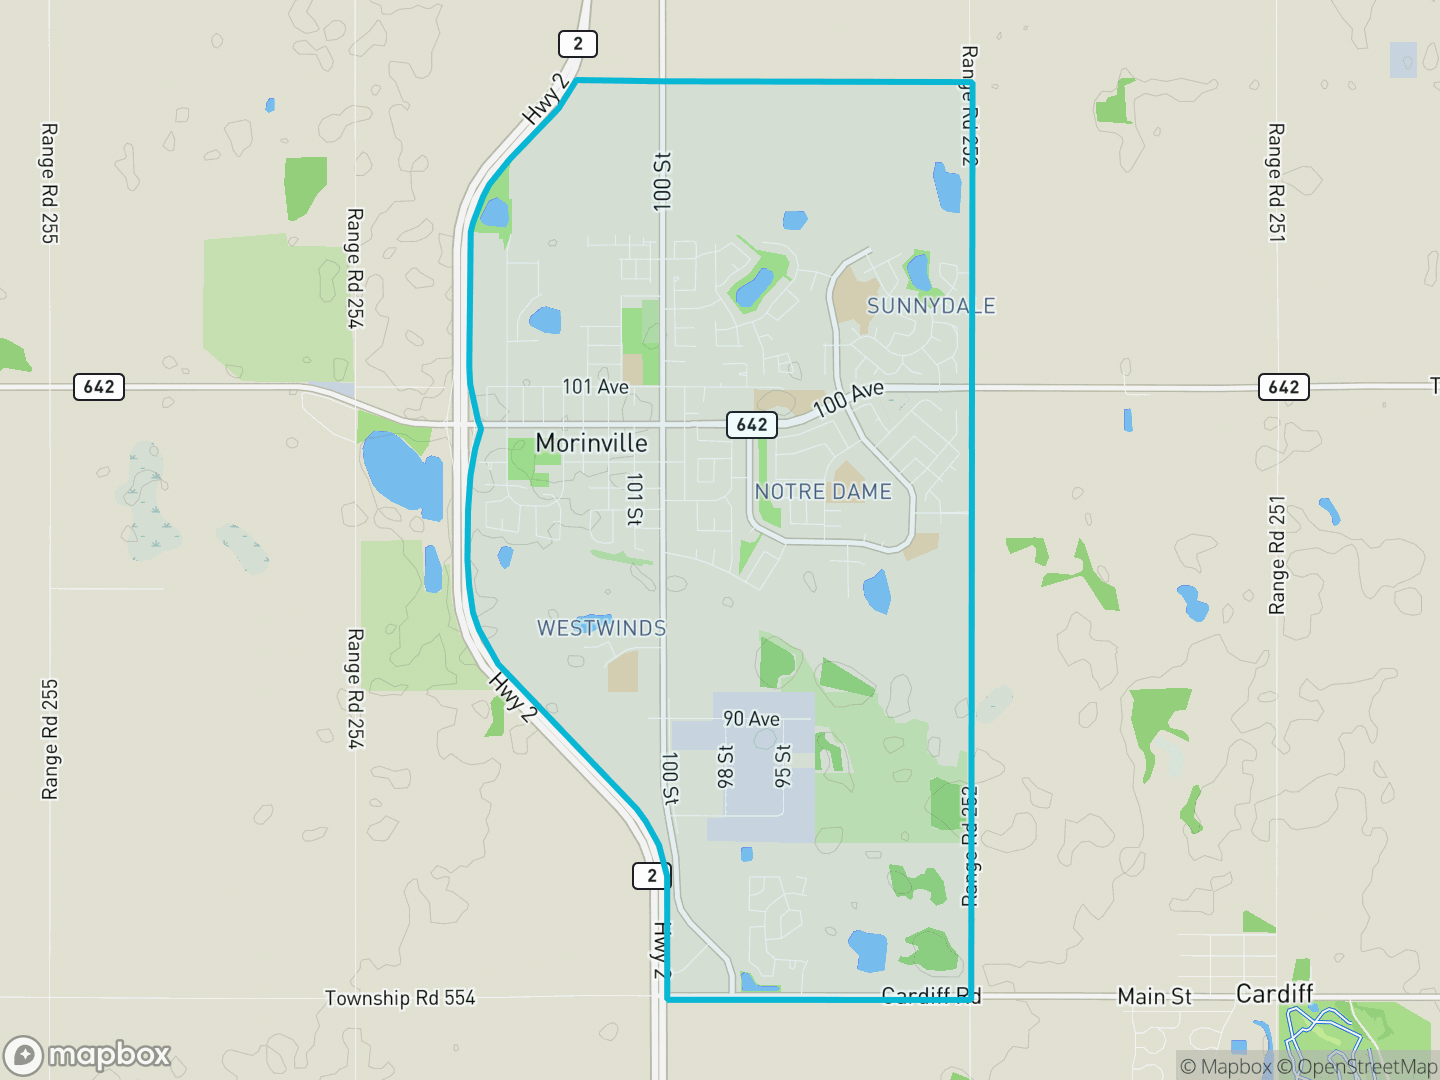
Where it is
Morinville sits in the Greater Edmonton metro.
The homes
What the housing stock looks like, and what homes are worth.
What's here
Mostly detached. 73% of homes, with 4% semi-detached.
Housing mix (2021 census · 3,765 dwellings)
What homes are worth (what owners figured, 2021)
Owners figured a median of $348,000 back in 2021 — for owner-occupied homes of all types (the average was $340,400). Homes are now selling for a rolling median of $409,225 (12 months to May 2026) — about 18% above that.
That's owners' self-reported value from the 2021 census — five years old and self-reported, so a rough, stale snapshot, not a current price. For what's actually trading now, see the market below.
Who lives here
Income, ownership, education and how people get to work — plus what housing costs.
Who lives here
Mostly homeowners. Median household income $108,000.
Income, households, ages & work
Household income
Households (average 2.7 people)
Ages (median 36.4)
Work — occupations
Work — industries
41% of residents moved here within the last 5 years (12% within the last year).
Immigration
5% of residents are immigrants.
2021 federal census, Morinville census subdivision. Income + ages are 100% data; work, immigration and mobility are 25% sample data, randomly rounded.
Origins, population groups & religion
Most commonly reported origins (multiple responses allowed — shares overlap)
Population groups
5% of residents identified as a visible minority; 95% did not. Separately, 11% identify as Indigenous (Métis 7%, First Nations 3%).
StatCan defines a "visible minority" as persons, other than Indigenous peoples, who are non-Caucasian in race or non-white in colour (Employment Equity Act) — Indigenous residents are counted separately, and "not a visible minority" is predominantly residents who identify as white.
Religion
Immigration, ethnocultural origin, population group and religion from the 2021 federal census (25% sample). Neutral Statistics Canada classifications, shown identically for every community.
Housing costs
Owners pay about $1,780/month; renters about $1,410/month. Median monthly shelter cost, 2021.
The market
What's actually selling — sold prices, sales activity and the trend, from the REALTORS® Association of Edmonton.
Recent sales & prices
Over the 12 months to May 2026, homes sold for a rolling median of $409,225 — +1.9% year-over-year, across 243 sales. That's the steady read; a single month swings on a few sales ($438,500 in May 2026 alone).
The headline is a 12-month rolling median — it pools the last 12 months (243 sales) so a single month's handful of sales can't swing it, and year-over-year is measured rolling-vs-rolling. RAE reports this town as a single residential total (not split by home type). Source: REALTORS® Association of Edmonton.
Price trend
The 12-month rolling median sale price is +1.9% year-over-year. Rolling median (bold) $352,500 → $409,225; the faint line is each single month.
12-month rolling median single-month median
The bold line is the 12-month rolling median; the faint line is each single month, which can swing on a few sales in a small market. Source: REALTORS® Association of Edmonton.
Source
Market statistics: Source: REALTORS® Association of Edmonton (monthly municipality statistics). Demographics: Statistics Canada, 2021 Census of Population, Census Profile (98-401-X), Morinville census subdivision. Directional analysis, not verbatim reproductions.
About these figures. Market figures are derived from RAE monthly statistics and reflect what sold, not what any specific home is worth; the 2021 census home value is residents' self-reported value, not a sale price or appraisal. Trevor Tardif is a licensed REALTOR® with REAL Broker AB Ltd, Edmonton, Alberta. Content on this site does not constitute financial or investment advice.
Thinking about buying or selling in Morinville?
These numbers are the starting point. I'll pull the live comparables for Morinville, tell you what your home would actually trade at today, and walk you through the move — buying or selling.