Edmonton Neighbourhood Profile
Hazeldean
Hazeldean is an Edmonton neighbourhood of about 1,095 homes — 94.3% houses and 5.7% condos, most homes built around 1955. The typical (median) house is assessed at $427,000, 5% below the citywide median (162nd of 277 neighbourhoods); condos around $199,250. Across its established houses — largely the same properties over time — the median assessed value changed +32% from 2012 to 2025. 59% of homes are owner-occupied, median household income is $89,000, and 2 public schools are designated for it. Figures throughout are City assessed values — directional and comparative, not exact sale prices ("typical" means the median).
Total homes
1,095
94.3% houses · 5.7% condos
Typical house
$427,000
5% below citywide · 162nd of 277
Typical condo
$199,250
6% above citywide
House $/sq ft
$407
$4,381/m² · 34% above citywide
Condo $/sq ft
$246
$2,648/m² · 30% above citywide
Typical lot
5,985 ft²
556 m² · 12% above citywide
Typical age
1955
median house build year
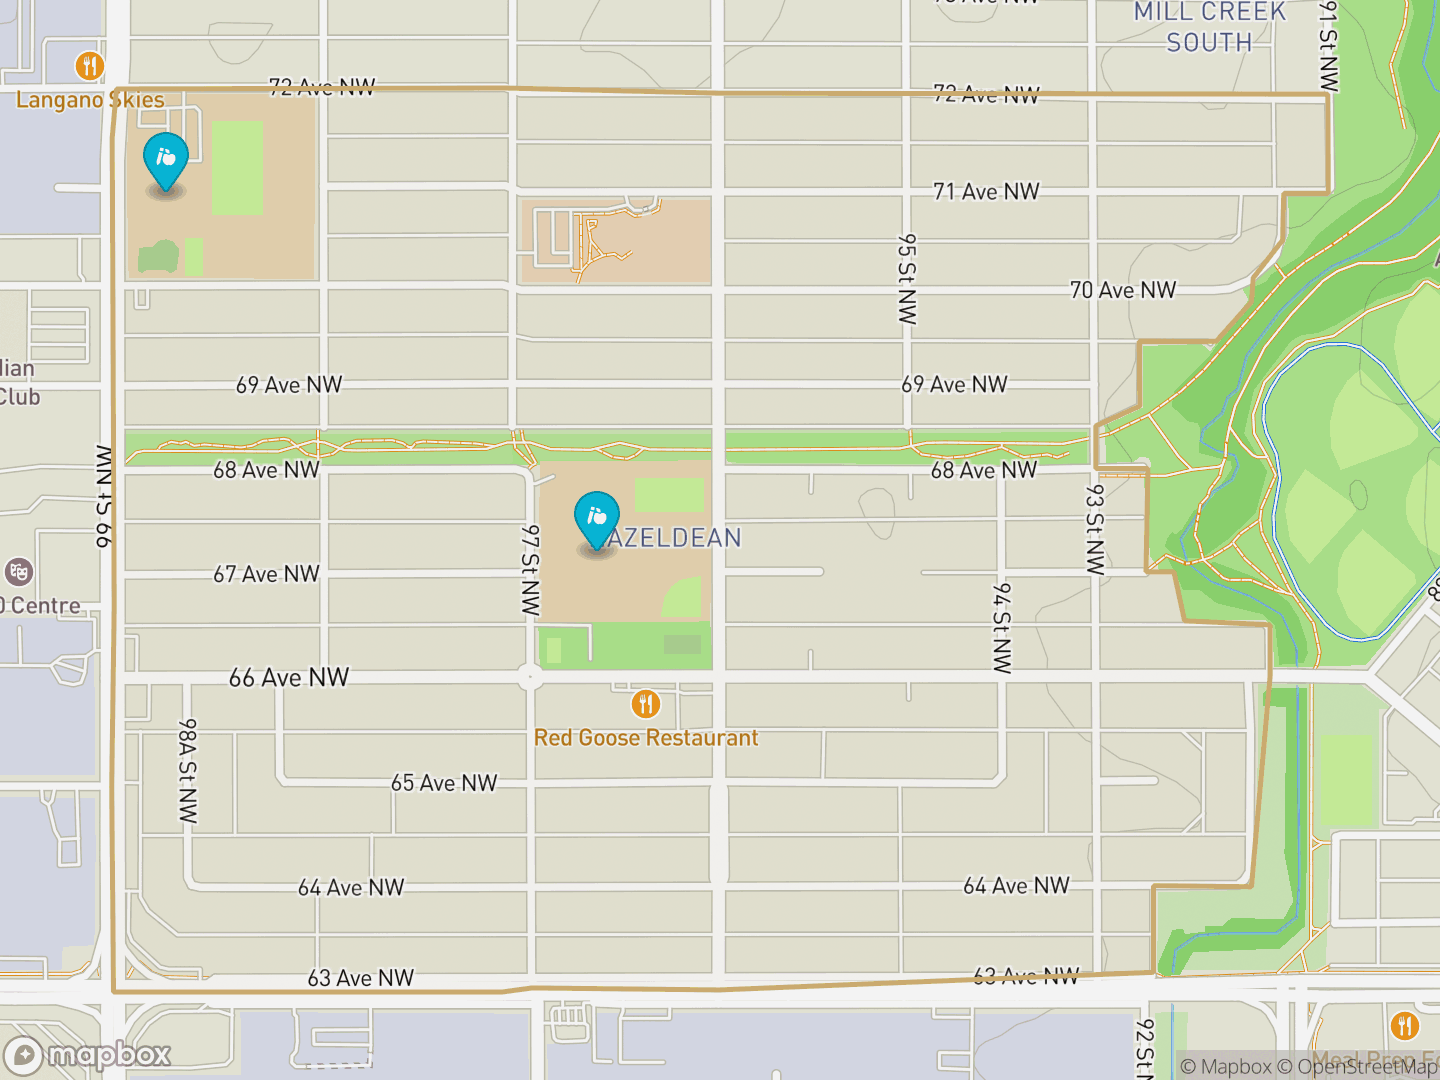
Where it is
At a glance.Hazeldean's location and boundary, with schools marked — green areas are parks and open space.
The homes
What's built here — the housing stock, its age, and the condo & rental supply.
What's here
Mostly houses. 94.3% houses (freehold) · 5.7% condos (condominium-titled).
Building types in detail
Bedrooms — homes here by bedroom count:
12% of homes needed major repairs in 2021, as assessed by their own residents.
Building-type, bedroom and condition figures from the 2021 federal census.
When it was built
Most homes here were built before 1960. The median build year is 1955.
Full age breakdown
Condos & multi-family
5 condo developments here — about 62 condo dwellings, plus 12 purpose-built rental / multi-family buildings.
How condos & rentals are counted
5 condo developments, the largest around 51 units — about 62 condo dwellings in total. Separately-titled parking and storage stalls aren't counted as homes.
12 rental / multi-family buildings, typically built around 1970 — 5 small (under $1M), 5 mid ($1–10M), 2 large (over $10M). Purpose-built rentals (assessed as a single parcel each), separate from the owned homes counted above. Unit counts aren't in the open data.
Living here
The people and the day-to-day — who lives here, and the schools, shops, parks and transit around them.
Who lives here
An even owner / renter mix. Median household income $89,000.
Resident snapshot from the 2021 federal census.
Median household income
$89,000
45% earn $100k+
Homeowners
59%
41% rent
Bachelor's degree or higher
29%
of residents 15+
Commute to work
79%
drive · 8% transit · 10% walk/bike
Median age 40; 32% of households have kids at home; 51% lived at a different address five years earlier.
Residents by age
Median age 40.
Household income spread
7% of households reported $200k or more; 20% under $50k.
Government transfers made up 17.6% of residents' 2020 income (including 5.7% pandemic supports — 2020 was a COVID income year); 8.5% of residents were below the low-income measure (LIM-AT).
Household total income, 2020, from the 2021 federal census (income shares and low-income prevalence as reported). Statistics Canada rounds and suppresses small counts, so shares may not sum exactly to 100.
Households & families
Average household size 2.3; families with kids at home average 1.6 children.
What residents do for work
Occupation groups (share of the labour force):
Industries residents work in (top 10; the rest combined):
Unemployment rate in the census reference week (May 2021): 14.3% — a pandemic-period snapshot.
How long people stay
18% of residents had moved within the previous year; 51% lived at a different address five years earlier.
Counts every change of address — moves within Hazeldean, into it, owners and renters alike.
Housing costs & affordability
A household earning the local median income would put about 24% of it toward typical owner shelter costs here — or 20% toward the typical rent.
Typical owner shelter cost
$1,760/mo
59% of owners hold a mortgage
Typical rent
$1,500/mo
median tenant shelter cost
Affordability in detail
Households spending 30% or more of their own income on their own shelter — the standard affordability-stress measure: 17.6% of owner households · 32.1% of renter households. (Different from the headline above, which compares the median cost against the median income — a typical-household what-if, not a count of stretched households.)
In core housing need (unaffordable, unsuitable or inadequate, with no affordable local alternative): 6.4% of owners · 21.1% of renters.
Owners' own estimate of their home's value (2021): $400,000 median — self-reported, so it can differ from the assessed medians above.
Owner costs reflect current owners — including long-time, mortgage-free ones — not the cost to buy in today. The income-share figures compare 2020 median household income with shelter costs reported in 2021.
Schools
2 designated public schools. Edmonton Public catchment for Hazeldean: Hazeldean and Strathcona.
All schools, levels & catchment notes
Designated public schools (Edmonton Public Schools catchment for Hazeldean):
- ElementaryHazeldeanK to Gr 6
- Senior HighStrathconaGr 10-12
Catchments are set by the school board and can change — and the City's published catchment data can lag new schools and boundary updates — so confirm the current designated school with Edmonton Public Schools before relying on it.
Schools located in Hazeldean:
- PublicHazeldeanElementary
- CatholicJ.H. PicardElementary
Independent / private schools aren't in the City's open data, so they aren't listed here. School-quality ratings are published separately by the Fraser Institute (not affiliated with this site). Catholic-school catchments aren’t published as open data, so Catholic schools are shown by location rather than catchment.
Shopping & amenities
About 35 businesses in Hazeldean, employing roughly 518 people.
Business mix & how this is counted
From the City's business census (2025 survey).
The mix of what's here, from currently-licensed businesses:
Counts come from City of Edmonton business licences and the City's business census — a licence means a business is registered at an address here, not a guarantee it's open today , and includes home-based businesses (about 39% of licences here). Landlord rental licences are excluded, and a listing isn't an endorsement.
Parks & green space
3 parks (11 hectares) and 1 playground in Hazeldean — includes a greenway (trail corridor).
Parks
3
11 hectares total
Playgrounds
1
1 wheelchair-accessible
Green-space types & notes
Types of green space:
- School & community park2
- Greenway1
Counts come from the City of Edmonton's parks and playgrounds open data. A park is attributed to the neighbourhood its centre point falls in, so a large park or greenway that spans several areas is counted once — treat boundaries as approximate. Trail corridors appear here as greenways; off-street bike routes aren't included.
Transit & connectivity
No LRT line in Hazeldean today. The nearest station is Avonmore (Valley Line Southeast), about 1.7 km away (straight-line). The neighbourhood is served by 5 bus routes.
Looking ahead, the nearest future stop is MacEwan Arts / 112 Street on the Valley Line West, about 5.2 km from the centre — under construction, targeted to open later this decade. Timelines can slip, and a nearby line doesn't imply any change in property values.
Nearest LRT
1.7 km
to Avonmore
Bus routes
5
serving the area
Future LRT
5.2 km
MacEwan Arts / 112 Street · under construction
Bus routes & notes
5 bus routes serve Hazeldean: 501, 502, 523, 525 and 656. They run from 16 boardable stops inside the neighbourhood.
No route here meets the frequent-service bar (≈ 15-minute weekday headway).
Bus routes and frequency come from the City's ETS GTFS schedule — the routes whose trips call at stops inside Hazeldean, with “frequent” meaning at least 100 weekday trips through the neighbourhood (about a bus every 15 minutes or better, counting both directions). Distances are straight-line (“as the crow flies”) from the neighbourhood centre — the actual walking or driving route is longer. Future stations are under construction; their locations and timelines come from City of Edmonton project pages and can change. Day-to-day commute mode (drive / transit / walk) is shown under “Who lives here.” Source: City of Edmonton LRT & ETS (GTFS) Open Data.
The market
Assessed value over time, and recent building activity.
Assessed value over time
Median assessed value changed +32% from 2012 to 2025.
That tracks Hazeldean's houses — largely the same homes throughout — so it's a real value change, not a shifting mix.
Building activity
Since 2015: 714 building permits, about 267 net new homes, and 77 secondary-suite permits.
Of those new units, roughly 83% are individually-owned (houses + condos), 16% purpose-built rental, and 0% in mixed-use buildings (0% other, e.g. hotels).
Split by building type (a strong proxy, not a guarantee of final tenure).
Permits year by year
Permits count every new home built — including purpose-built rental apartments and mixed-use buildings — so this can run well above the "total homes" figure above, which counts only individually-owned houses and condos.
Source
City of Edmonton Open Data — assessment, property info, building permits; Statistics Canada 2021 Census of Population (City of Edmonton neighbourhood tabulation). Contains information licensed under the Open Government Licence – City of Edmonton.
About these figures. They use the City of Edmonton's annual property assessment — its mass-appraisal estimate of value as of July 1 the prior year, informed by that year's sales but applied across the whole roll at once. That makes it a reliable directional and comparative signal (ideal for "how does this neighbourhood compare"), but not the exact price a specific home would sell for today — for that you need a comparative market analysis. Resident demographics and housing-cost figures (income and its distribution, age, education, commute, tenure, household types, shelter costs, occupations and industries, mobility) and the building-type, bedroom and condition mix are from the 2021 federal census — the most recent neighbourhood-level vintage; the City notes it fell during the pandemic, so treat these figures as directional. Census figures are adapted from Statistics Canada, 2021 Census of Population; this does not constitute an endorsement by Statistics Canada. Trevor Tardif is a licensed REALTOR® with REAL Broker AB Ltd, Edmonton, Alberta. Content on this site does not constitute financial or investment advice.
What's your Hazeldean home actually worth?
Assessed value is a starting point, not a sale price. I'll run a real comparative market analysis on your specific home and walk you through the number.