Edmonton area profile
Central
Covers Downtown, Wîhkwêntôwin (Oliver), Glenora and Westmount.
Central groups 17 Edmonton neighbourhoods — about 29,337 homes, 32.3% houses and 67.7% condos. The typical (median) house is assessed around $411,500, 8% below the citywide median; condos around $160,500. Across its established condos, the median assessed value changed -12% from 2012 to 2025. 33% of homes are owner-occupied, the average household income is about $84,222. Area figures are averages and City assessed values — directional, not sale prices ("typical" means the median; averages are noted as such).
“Central” follows the City of Edmonton's official Central planning district — one of 15 the City uses to group its 300+ neighbourhoods. Figures roll up the City's 2025 assessed values and the 2021 federal census across the area's neighbourhoods. Where a median can't be combined across neighbourhoods (income, age, shelter), the page shows the average instead — so those read higher than the medians on the neighbourhood pages and aren't directly comparable.
Neighbourhoods
17
profiled in this area
Total homes
29,337
32.3% houses · 67.7% condos
Typical house
$411,500
8% below citywide
Typical condo
$160,500
15% below citywide
House $/sq ft
$320
5% above citywide
Condo $/sq ft
$191
1% above citywide
Typical lot
6,566 ft²
23% above citywide
Avg. household income
$84,222
2021 · average, not median
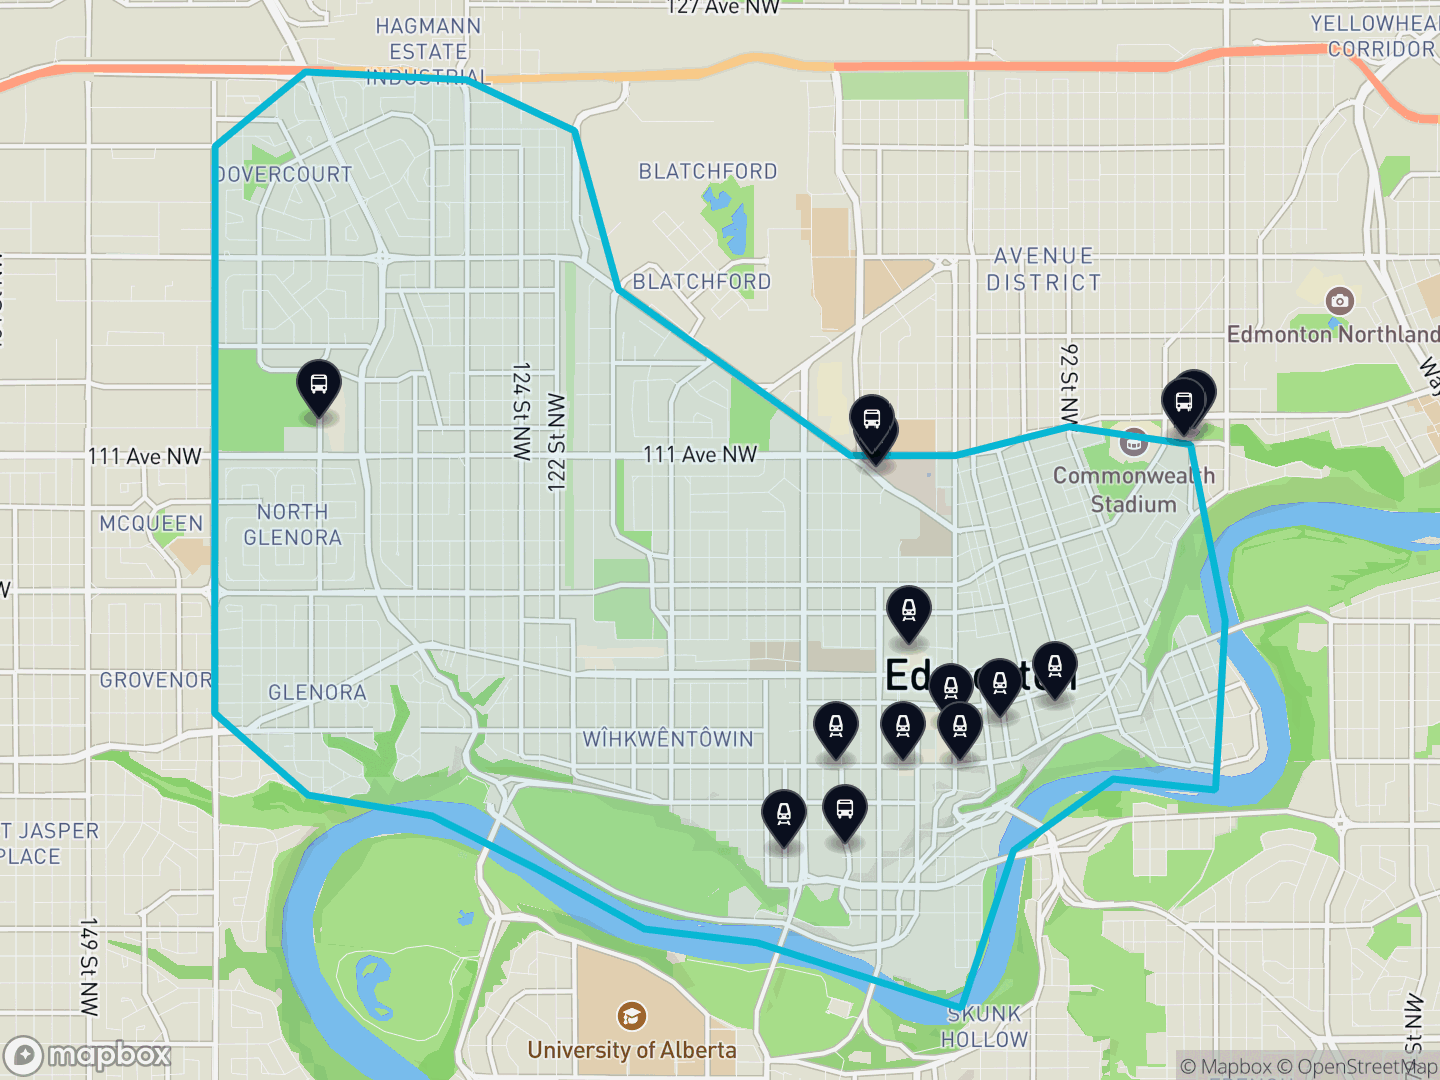
Where it is
At a glance. Central and its boundary, with LRT and transit centres marked — green areas are parks and open space.
Stay in the loop
Get the Edmonton market update
My monthly read — what's selling, where prices are headed, and what it means.
The homes
What's here, when it was built, and the condo & rental stock — rolled up across the area's neighbourhoods.
What's here
Mostly condos. 32.3% houses · 67.7% condos.
Built-form mix & bedrooms (2021 census · 159% coverage)
When it was built
Most units here were built in the 2000s. The median build year is 1998.
Building age, by decade
Condos & multi-family
Condos are 67.7% of homes — most in Wîhkwêntôwin, Downtown and Queen Mary Park. Plus 1241 purpose-built rental buildings.
How the condo & rental stock breaks down
Across roughly 533 condo developments, the largest about 461 units. Separately-titled parking and storage aren't counted as homes.
1241 rental / multi-family buildings, typically built around 1973 — 523 small (under $1M), 602 mid ($1–10M), 116 large (over $10M). Purpose-built rentals (assessed as single parcels), separate from the owned homes; unit counts aren't in the open data.
Living here
Who lives in the area, what housing costs, and the schools, shopping, transit and parks across the district.
Who lives here
Mostly renters. Average household income $84,222, average age 40.2.
Income, age and household size are averages (these combine exactly across neighbourhoods, where a median can't) — so they read higher than the medians shown on the neighbourhood pages. The distribution shares below are exact counts.
Income, households, ages, work & mobility
Household income (27% earn $100k+)
Households (average 1.8 people)
Ages (average 40.2)
Work — occupations
Work — industries
58% of residents moved here within the last 5 years (23% within the last year).
Origins, immigration & religion
69% born in Canada · 27% immigrants · 4% non-permanent residents.
Most commonly reported origins (multiple responses allowed — shares overlap)
Population groups
34% of residents identified as a visible minority; 66% did not. Separately, 8% identify as Indigenous.
StatCan defines a "visible minority" as "persons, other than Aboriginal peoples, who are non-Caucasian in race or non-white in colour" (Employment Equity Act) — so Indigenous residents are counted separately, and the "not a visible minority" share is predominantly residents who identify as white.
Religion
Immigration, ethnocultural origin, population group and religion from the 2021 federal census, summed across the district's neighbourhoods. Neutral Statistics Canada classifications, shown identically for every area.
Housing costs
Owners pay about $1,641/month; renters about $1,147/month. Average monthly shelter cost, 2021.
Schools
23 schools across Central — 14 public · 9 Catholic. Senior highs: Centre High, Ross Sheppard, St. Joseph, Victoria.
Schools by level & senior highs
Counts schools located in the district (a school offering several levels is counted in each). Public = Edmonton Public, Catholic = Edmonton Catholic. Fraser Institute rankings → · private/independent schools aren't in the City's open data.
Shopping
Major shopping centres here: Brewery District / Oliver Square, Edmonton City Centre, Westmount Shopping Centre.
Edmonton's major malls and power centres located in this district. Everyday retail (groceries, pharmacies, services) is spread across the neighbourhoods.
Transit
Served by the Capital Line & Metro Line & Valley Line, with 10 LRT stations in the area and 4 transit centres.
LRT stations & transit centres
LRT: 102 Street (Valley Line Southeast), Bay Enterprise Square (Capital & Metro Lines), Central (Capital & Metro Lines), Churchill (Valley Line Southeast / Capital & Metro Lines), Corona (Capital & Metro Lines), Government (Capital & Metro Lines), Kingsway RAH (Metro Line), MacEwan (Metro Line), Quarters (Valley Line Southeast), Stadium (Capital Line).
Transit centres: Government Transit Centre, Kingsway RAH Transit Centre, Stadium Transit Centre, Westmount Transit Centre.
Parks & green space
130 parks covering about 378 hectares, including 11 natural areas and river-valley / ravine greenway.
The largest parks
- Commonwealth Stadium19 ha
The market
How assessed values have moved, and how much has been built.
Assessed value over time
The median assessed condo value changed -12% from 2012 to 2025.
Established condos — largely the same properties over time, so this mostly reflects real value change.
Building activity
Since 2015: 11,971 building permits and 11,802 net new units, plus 617 secondary suites.
Permits, units & suites year by year
Permits count every new home — including purpose-built rental and mixed-use buildings — so the yearly units can run above the owned house/condo count above. “Units” are net of demolitions, so a redeveloping year can read negative; “suites” are secondary-suite permits (basement / garden / garage suites).
The neighbourhoods
Every neighbourhood in Central, sorted by number of homes — each links to its full data-driven profile.
- Wîhkwêntôwin 7,440 homes · typical house $465,500
- Downtown 5,722 homes · typical house $444,000
- Westmount 2,664 homes · typical house $537,250
- Queen Mary Park 2,115 homes · typical house $398,500
- Inglewood 1,518 homes · typical house $382,000
- Glenora 1,510 homes · typical house $819,000
- Boyle Street 1,202 homes · typical house $333,500
- Central McDougall 957 homes · typical house $318,750
- Sherbrooke 929 homes · typical house $344,000
- Riverdale 847 homes · typical house $581,000
- McCauley 819 homes · typical house $240,000
- Dovercourt 763 homes · typical house $344,000
- North Glenora 734 homes · typical house $437,500
- Woodcroft 690 homes · typical house $388,500
- Prince Charles 600 homes · typical house $305,500
- Prince Rupert 472 homes · typical house $361,000
- Rossdale 355 homes · typical house $603,250
Source
City of Edmonton Open Data — property assessment & property information, building permits (2025); Statistics Canada 2021 Census of Population (City of Edmonton neighbourhood tabulation); area boundaries from City Plan Districts. Contains information licensed under the Open Government Licence – City of Edmonton. Demographics: Statistics Canada 2021 Census of Population (City of Edmonton neighbourhood tabulation). Area boundaries: City Plan Districts.
About these figures. Area figures roll up the City's mass-appraisal assessed values and the 2021 federal census across this district's neighbourhoods — a directional, comparative signal, not the price a specific home would sell for. Income, age and shelter figures are averages (labelled), which read higher than medians and aren't directly comparable to the neighbourhood pages. Trevor Tardif is a licensed REALTOR® with REAL Broker AB Ltd, Edmonton, Alberta. Content on this site does not constitute financial or investment advice.
Zooming out: see the Edmonton economy — jobs, rents, vacancy and interest rates for the whole region.
Stay in the loop
Following Central? Get the bigger picture.
Central is one part of the city — but the forces that move its prices play out region-wide. That's what my market read tracks.
Weighing Central against another part of the city?
The profiles are the starting point. I'll run the comparison for your shortlist — what each area actually trades at, and which neighbourhoods fit what you're after — and walk you through it.