
Edmonton Neighbourhood Profile
Goodridge Corners
Goodridge Corners is an Edmonton neighbourhood of about 120 homes — 100% houses and 0% condos, most homes built around 1968. The typical (median) house is assessed at $174,750, 63% below the citywide median (278th of 282 neighbourhoods). Figures throughout are City assessed values — directional and comparative, not exact sale prices ("typical" means the median).
Total homes
120
100% houses · 0% condos
Typical house
$174,750
63% below citywide · 278th of 282
House $/sq ft
$139
$1,496/m² · 56% below citywide
Typical lot
3,961 ft²
368 m² · 25% below citywide
Typical age
1968
median house build year
Part of Northwest — see the area profile for Goodridge Corners's wider market context.
Where it is
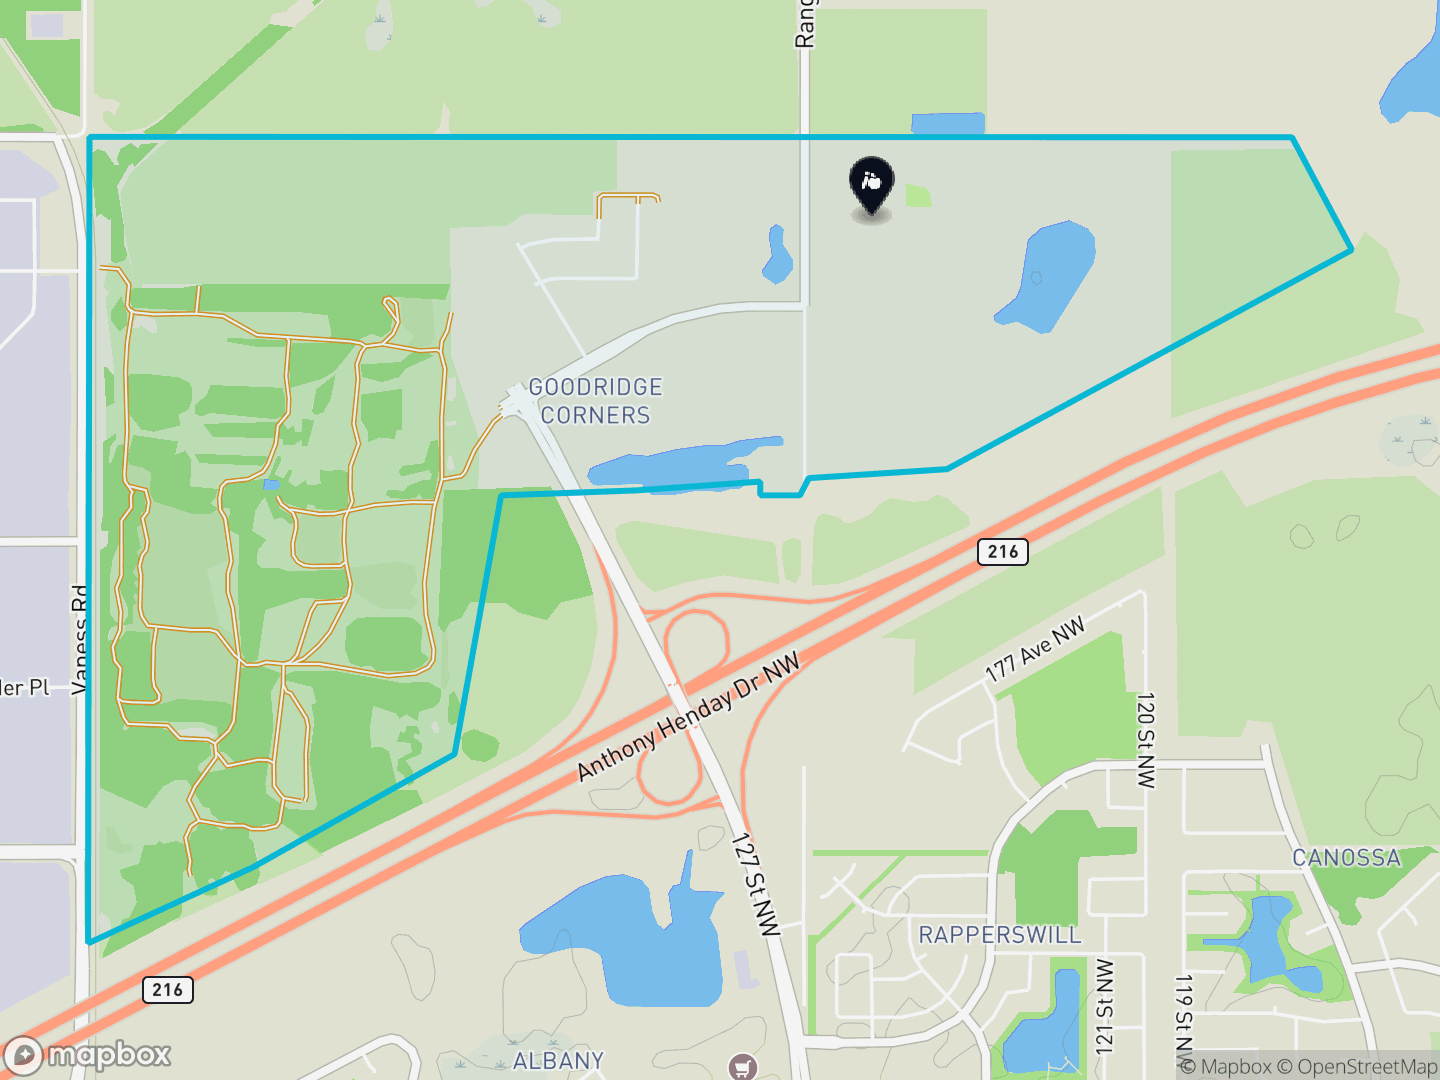
At a glance.Goodridge Corners's location and boundary, with schools marked — green areas are parks and open space.
Stay in the loop
Get the Edmonton market update
My monthly read — what's selling, where prices are headed, and what it means.
The homes
What's built here — the housing stock, its age, and the condo & rental supply.
What's here
Mostly houses. 100% houses (freehold) · 0% condos (condominium-titled).
Living here
The people and the day-to-day — who lives here, and the schools, shops, parks and transit around them.
Who lives here
Resident snapshot from the 2021 federal census.
Heads up — the 2021 federal census captured about ~0% of today's homes here; Goodridge Corners has kept growing since, so read these resident figures as recent but partial.
Median age 32.4.
Residents by age
Median age 32.4.
Schools
3 designated public schools. Edmonton Public catchment for Goodridge Corners: Lorelei, Mary Butterworth and Queen Elizabeth.
All schools, levels & catchment notes
Designated public schools (Edmonton Public Schools catchment for Goodridge Corners):
- ElementaryLoreleiK to Gr 6
- Junior HighMary ButterworthGr 7-9
- Senior HighQueen ElizabethGr 10-12
Catchments are set by the school board and can change — and the City's published catchment data can lag new schools and boundary updates — so confirm the current designated school with Edmonton Public Schools before relying on it.
Schools located in Goodridge Corners:
- PublicInstitut Serv SchsSpecialized
Independent / private schools aren't in the City's open data, so they aren't listed here. School-quality ratings are published separately by the Fraser Institute (not affiliated with this site).
Shopping & amenities
About 6 businesses in Goodridge Corners, employing roughly 1,167 people.
Business mix & how this is counted
From the City's business census (2025 survey).
The mix of what's here, from currently-licensed businesses:
Counts come from City of Edmonton business licences and the City's business census — a licence means a business is registered at an address here, not a guarantee it's open today . Landlord rental licences are excluded, and a listing isn't an endorsement.
Transit & connectivity
No LRT line in Goodridge Corners today. The nearest station is Kingsway RAH (Metro Line), about 10.1 km away (straight-line).
Looking ahead, the nearest future stop is Glenora on the Valley Line West, about 10.7 km from the centre — under construction, targeted to open later this decade. Timelines can slip, and a nearby line doesn't imply any change in property values.
Nearest LRT
10.1 km
to Kingsway RAH
Future LRT
10.7 km
Glenora · under construction
Transit notes
Bus-route data isn't available for Goodridge Corners yet.
Bus routes and frequency come from the City's ETS GTFS schedule — the routes whose trips call at stops inside Goodridge Corners, with “frequent” meaning at least 100 weekday trips through the neighbourhood (about a bus every 15 minutes or better, counting both directions). Distances are straight-line (“as the crow flies”) from the neighbourhood centre — the actual walking or driving route is longer. Future stations are under construction; their locations and timelines come from City of Edmonton project pages and can change. Day-to-day commute mode (drive / transit / walk) is shown under “Who lives here.” Source: City of Edmonton LRT & ETS (GTFS) Open Data.
The market
Assessed value over time, and recent building activity.
Assessed value over time
Not enough years of assessment history to chart a value trend here yet.
Building activity
Since 2016: 81 building permits, about 99 net new homes, and 14 secondary-suite permits.
Of those new units, roughly 63% are individually-owned (houses + condos), 38% purpose-built rental, and 0% in mixed-use buildings.
Split by building type (a strong proxy, not a guarantee of final tenure).
Permits year by year
Permits count every new home built — including purpose-built rental apartments and mixed-use buildings — so this can run well above the "total homes" figure above, which counts only individually-owned houses and condos.
Source
City of Edmonton Open Data — current-year property assessment & information, historical assessment roll (value trend), building permits; Statistics Canada 2021 Census of Population (City of Edmonton neighbourhood tabulation). Contains information licensed under the Open Government Licence – City of Edmonton.
About these figures. They use the City of Edmonton's 2026 assessment roll — its mass-appraisal estimate of market value as of July 1, 2025, informed by that year's sales but applied across the whole roll at once. That makes it a reliable directional and comparative signal (ideal for "how does this neighbourhood compare"), but not the exact price a specific home would sell for today — for that you need a comparative market analysis. Resident demographics and housing-cost figures (income and its distribution, age, education, commute, tenure, household types, shelter costs, occupations and industries, mobility) and the building-type, bedroom and condition mix are from the 2021 federal census — the most recent neighbourhood-level vintage; the City notes it fell during the pandemic, so treat these figures as directional. Census figures are adapted from Statistics Canada, 2021 Census of Population; this does not constitute an endorsement by Statistics Canada. Trevor Tardif is a licensed REALTOR® with REAL Broker AB Ltd, Edmonton, Alberta. Content on this site does not constitute financial or investment advice.
Stay in the loop
Watching Goodridge Corners? Get the bigger picture.
Goodridge Corners is one neighbourhood — but the forces that move its prices play out city-wide. That's what my market read tracks.
What's your Goodridge Corners home actually worth?
Assessed value is a starting point, not a sale price. I'll run a real comparative market analysis on your specific home and walk you through the number.