
Edmonton Neighbourhood Profile
Westview Village
Westview Village is an Edmonton neighbourhood of about 1,059 homes — 100% houses and 0% condos, most homes built around 1984. The typical (median) house is assessed at $76,500, 84% below the citywide median (280th of 282 neighbourhoods). 89% of homes are owner-occupied, median household income is $70,000, and 3 public schools are designated for it. Figures throughout are City assessed values — directional and comparative, not exact sale prices ("typical" means the median).
Total homes
1,059
100% houses · 0% condos
Typical house
$76,500
84% below citywide · 280th of 282
House $/sq ft
$65
$700/m² · 80% below citywide
Typical age
1984
median house build year
Part of West Henday — see the area profile for Westview Village's wider market context.
Where it is
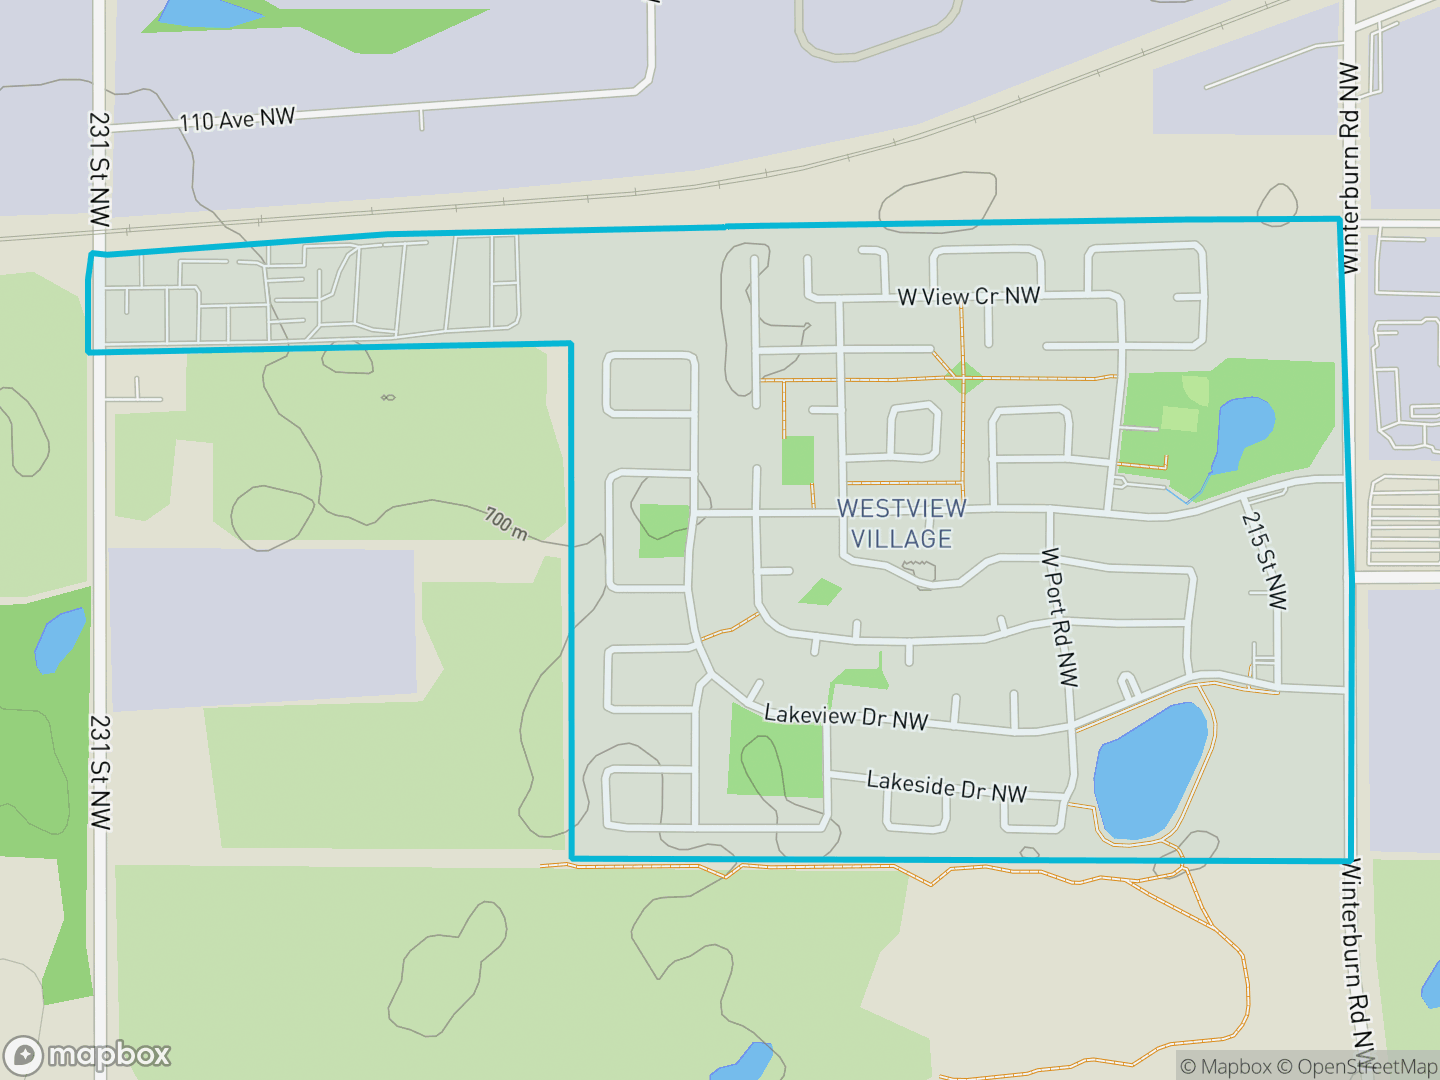
At a glance.Westview Village's location and boundary — green areas are parks and open space.
Stay in the loop
Get the Edmonton market update
My monthly read — what's selling, where prices are headed, and what it means.
The homes
What's built here — the housing stock, its age, and the condo & rental supply.
What's here
Mostly houses. 100% houses (freehold) · 0% condos (condominium-titled).
Building types in detail
Bedrooms — homes here by bedroom count:
17% of homes needed major repairs in 2021, as assessed by their own residents.
Building-type, bedroom and condition figures from the 2021 federal census.
When it was built
Most homes here were built in the 1970s. The median build year is 1984.
Full age breakdown
Living here
The people and the day-to-day — who lives here, and the schools, shops, parks and transit around them.
Who lives here
Mostly homeowners. Median household income $70,000.
Resident snapshot from the 2021 federal census.
Median household income
$70,000
24% earn $100k+
Homeowners
89%
11% rent
Bachelor's degree or higher
5%
of residents 15+
Commute to work
97%
drive · 2% transit · 0% walk/bike
Median age 48.4; 35% lived at a different address five years earlier.
Residents by age
Median age 48.4.
Household income spread
3% of households reported $200k or more; 30% under $50k.
Government transfers made up 29% of residents' 2020 income (including 7.7% pandemic supports — 2020 was a COVID income year); 13.5% of residents were below the low-income measure (LIM-AT).
Household total income, 2020, from the 2021 federal census (income shares and low-income prevalence as reported). Statistics Canada rounds and suppresses small counts, so shares may not sum exactly to 100.
Households & families
Average household size 2.1; families with kids at home average 1.4 children.
What residents do for work
Occupation groups (share of the labour force):
Industries residents work in (top 10; the rest combined):
Unemployment rate in the census reference week (May 2021): 18.1% — a pandemic-period snapshot.
How long people stay
13% of residents had moved within the previous year; 35% lived at a different address five years earlier.
Counts every change of address — moves within Westview Village, into it, owners and renters alike.
Immigration & citizenship
94% of residents were born in Canada; 5% are immigrants.
When the area's immigrants arrived:
Immigrant status and period of immigration, the 2021 federal census. Counts everyone in private households.
Ethnocultural origins
The origins residents most often reported. People can report more than one, so these overlap and don't add up to 100%.
Ethnic or cultural origin, the 2021 federal census — share of residents reporting each (multiple responses allowed).
Population groups
2% of residents identified as a visible minority; 98% did not.
Separately, 9% of residents identify as Indigenous.
Statistics Canada defines a "visible minority" as "persons, other than Aboriginal peoples, who are non-Caucasian in race or non-white in colour" (the federal Employment Equity Act's wording). That's why Indigenous residents are shown separately above, and why there's no "white" category here: the residents counted as "not a visible minority" are predominantly those who identify as white, plus the Indigenous residents shown above. Shares are of all residents, the 2021 federal census.
Religion
Religion, the 2021 federal census. The census asks this once a decade (most recently 2021); major groups shown.
Housing costs & affordability
A household earning the local median income would put about 12% of it toward typical owner shelter costs here — or 24% toward the typical rent.
Typical owner shelter cost
$700/mo
47.4% of owners hold a mortgage
Typical rent
$1,420/mo
median tenant shelter cost
Affordability in detail
Households spending 30% or more of their own income on their own shelter — the standard affordability-stress measure: 15% of owner households · 42.9% of renter households. (Different from the headline above, which compares the median cost against the median income — a typical-household what-if, not a count of stretched households.)
In core housing need (unaffordable, unsuitable or inadequate, with no affordable local alternative): 11.8% of owners · 30% of renters.
Owners' own estimate of their home's value (2021): $65,000 median — self-reported, so it can differ from the assessed medians above.
Owner costs reflect current owners — including long-time, mortgage-free ones — not the cost to buy in today. The income-share figures compare 2020 median household income with shelter costs reported in 2021.
Schools
3 designated public schools. Edmonton Public catchment for Westview Village: Winterburn, Michael Phair and Jasper Place.
All schools, levels & catchment notes
Designated public schools (Edmonton Public Schools catchment for Westview Village):
- ElementaryWinterburnK to Gr 6
- Junior HighMichael PhairGr 7-9
- Senior HighJasper PlaceGr 10-12
Catchments are set by the school board and can change — and the City's published catchment data can lag new schools and boundary updates — so confirm the current designated school with Edmonton Public Schools before relying on it.
Independent / private schools aren't in the City's open data, so they aren't listed here. School-quality ratings are published separately by the Fraser Institute (not affiliated with this site).
Shopping & amenities
About 8 businesses in Westview Village, employing roughly 81 people.
Business mix & how this is counted
From the City's business census (2025 survey).
The mix of what's here, from currently-licensed businesses:
Counts come from City of Edmonton business licences and the City's business census — a licence means a business is registered at an address here, not a guarantee it's open today , and includes home-based businesses (about 44% of licences here). Landlord rental licences are excluded, and a listing isn't an endorsement.
Transit & connectivity
No LRT line in Westview Village today. The nearest station is Health Sciences Jubilee (Capital & Metro Lines), about 11.8 km away (straight-line). The neighbourhood is served by 1 bus route.
Looking ahead, the nearest future stop is Lewis Farms on the Valley Line West, about 3.9 km from the centre — under construction, targeted to open later this decade. Timelines can slip, and a nearby line doesn't imply any change in property values.
Nearest LRT
11.8 km
to Health Sciences Jubilee
Bus routes
1
serving the area
Future LRT
3.9 km
Lewis Farms · under construction
Bus routes & notes
1 bus route serves Westview Village: 921. They run from 8 boardable stops inside the neighbourhood.
No route here meets the frequent-service bar (≈ 15-minute weekday headway).
Bus routes and frequency come from the City's ETS GTFS schedule — the routes whose trips call at stops inside Westview Village, with “frequent” meaning at least 100 weekday trips through the neighbourhood (about a bus every 15 minutes or better, counting both directions). Distances are straight-line (“as the crow flies”) from the neighbourhood centre — the actual walking or driving route is longer. Future stations are under construction; their locations and timelines come from City of Edmonton project pages and can change. Day-to-day commute mode (drive / transit / walk) is shown under “Who lives here.” Source: City of Edmonton LRT & ETS (GTFS) Open Data.
The market
Assessed value over time, and recent building activity.
Assessed value over time
Not enough years of assessment history to chart a value trend here yet.
Building activity
Since 2015: 85 building permits, a net loss of about 2 homes.
Permits year by year
Permits count every new home built — including purpose-built rental apartments and mixed-use buildings — so this can run well above the "total homes" figure above, which counts only individually-owned houses and condos.
Source
City of Edmonton Open Data — current-year property assessment & information, historical assessment roll (value trend), building permits; Statistics Canada 2021 Census of Population (City of Edmonton neighbourhood tabulation). Contains information licensed under the Open Government Licence – City of Edmonton.
About these figures. They use the City of Edmonton's 2026 assessment roll — its mass-appraisal estimate of market value as of July 1, 2025, informed by that year's sales but applied across the whole roll at once. That makes it a reliable directional and comparative signal (ideal for "how does this neighbourhood compare"), but not the exact price a specific home would sell for today — for that you need a comparative market analysis. Resident demographics and housing-cost figures (income and its distribution, age, education, commute, tenure, household types, shelter costs, occupations and industries, mobility) and the building-type, bedroom and condition mix are from the 2021 federal census — the most recent neighbourhood-level vintage; the City notes it fell during the pandemic, so treat these figures as directional. Census figures are adapted from Statistics Canada, 2021 Census of Population; this does not constitute an endorsement by Statistics Canada. Trevor Tardif is a licensed REALTOR® with REAL Broker AB Ltd, Edmonton, Alberta. Content on this site does not constitute financial or investment advice.
Stay in the loop
Watching Westview Village? Get the bigger picture.
Westview Village is one neighbourhood — but the forces that move its prices play out city-wide. That's what my market read tracks.
What's your Westview Village home actually worth?
Assessed value is a starting point, not a sale price. I'll run a real comparative market analysis on your specific home and walk you through the number.